085 222 0619Available 8:00 - 18:00

Questions? Call us directly
Try adjusting your search criteria or explore other areas.

We can help you search; free and no strings attached. Call us directly or leave a search request.
Retail space for rent
Retail space for rent
Retail space for rent
Retail space for rent
Retail space for rent
Retail space for rent
Retail space for rent
Retail space for rent
Retail space for rent
Retail space for rent
Retail space for rent
Retail space for rent
Retail space for rent
Retail space for rent
Retail space for rent
Retail space for rent
Retail space for rent
Retail space for rent
Source: CBS Kerncijfers wijken & buurten
Number of establishments

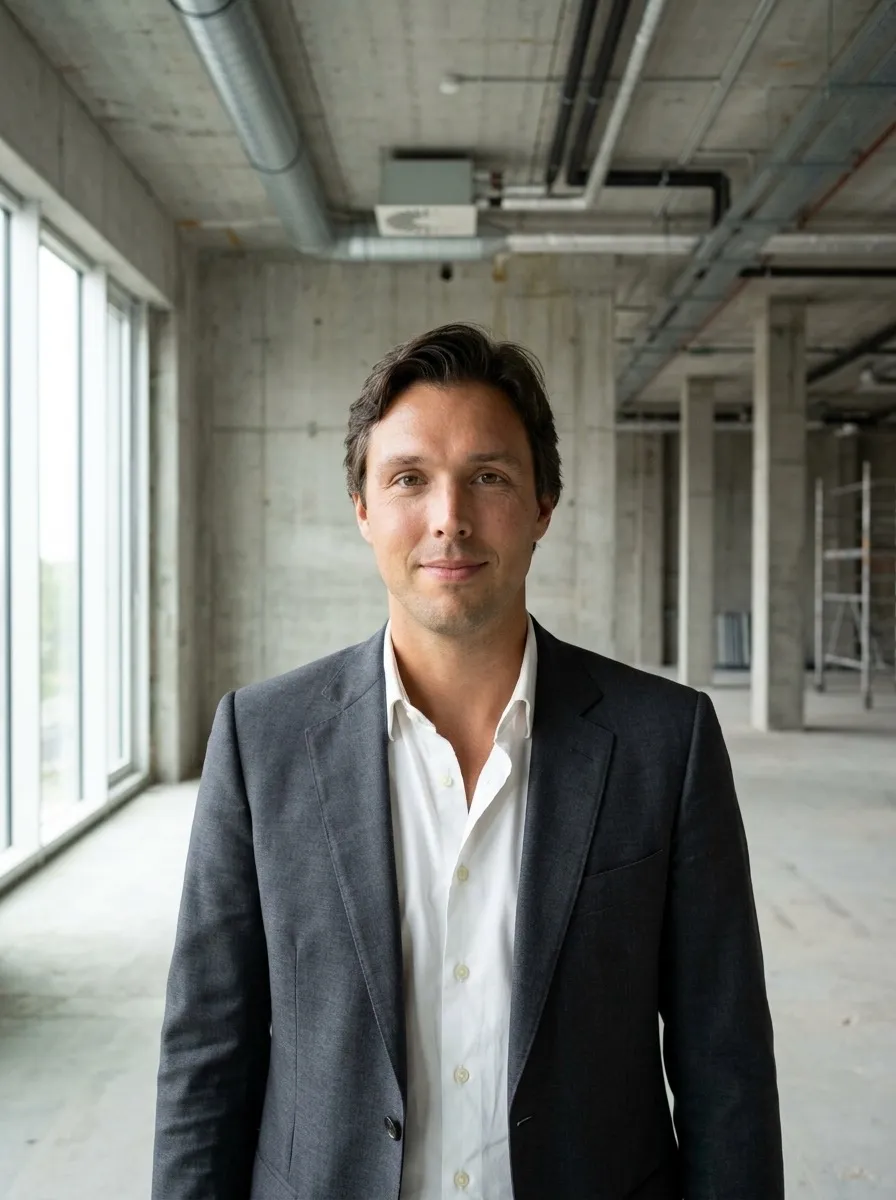
Miquel van Dongen
Tech Director
As Tech Director at RE-SEARCH, Miquel van Dongen is co-responsible for developing the platform and for collecting, structuring and analysing data. By combining technology with real estate expertise, he ensures that RE-SEARCH can continuously generate reliable and up-to-date market data.
Rijnsweerd is a vibrant neighbourhood with approximately 33,500 residents distributed across 22,230 households, anchored by a substantial economic presence of 6,850 business establishments and 1,562 commercial properties. The district's economic profile is decisively shaped by the dominance of business services, which accounts for 2,430 establishments and reflects a robust professional services sector that attracts knowledge-intensive companies and corporate operations. This is complemented by a significant presence of public administration, education, and healthcare facilities housing 1,450 establishments, alongside cultural and recreational services with 920 establishments, creating a diversified economy that extends well beyond traditional retail. The modest retail and hospitality sector with 690 establishments indicates that while consumer-facing businesses exist, the neighbourhood's character is primarily driven by office-based and institutional activities rather than high street commerce.
For prospective commercial tenants and investors, Rijnsweerd presents compelling fundamentals grounded in a working population of 20,470 with a strong net labour participation rate of 71 percent, ensuring reliable availability of skilled workforce across multiple sectors. With an average annual income per resident of €41,200, the area demonstrates solid local purchasing power and economic stability that benefits service providers and light industrial operators alike. The overwhelming concentration of business services establishments positions the neighbourhood as an exceptionally attractive location for office and professional service operators seeking accessible talent pools and established business networks. While the limited hospitality and retail presence suggests this is not an optimal location for traditional retail concepts, the infrastructure, employment base, and institutional anchors make it particularly well-suited for corporate headquarters, professional consultancies, logistics coordination centres, and companies serving the B2B market.
CBS dataset: 85984NED · Last updated: June 29, 2026
Market insights, tips and guides: immediately useful while you search.
 Marktinzicht
Amsterdam, Rotterdam, The Hague, Utrecht and Eindhoven each have a distinct real estate DNA. Here's how they compare across offices, logistics and retail.
MarktinzichtWhat does renting office space actually cost in 2026? Compare prices, hidden costs, and location value across Amsterdam, Rotterdam, Utrecht, and Eindhoven.
 Huurders
GFA, NLA and usable floor area explained under NEN 2580, with a worked example for an office building and tips for comparing rent per m² fairly.
Services
Receive our newsletter on commercial real estate, new RE-CONNECT features and market developments.

© 2026 RE-SEARCH B.V. · CoC 42071161. All rights reserved