085 222 0619Available 8:00 - 18:00

Questions? Call us directly
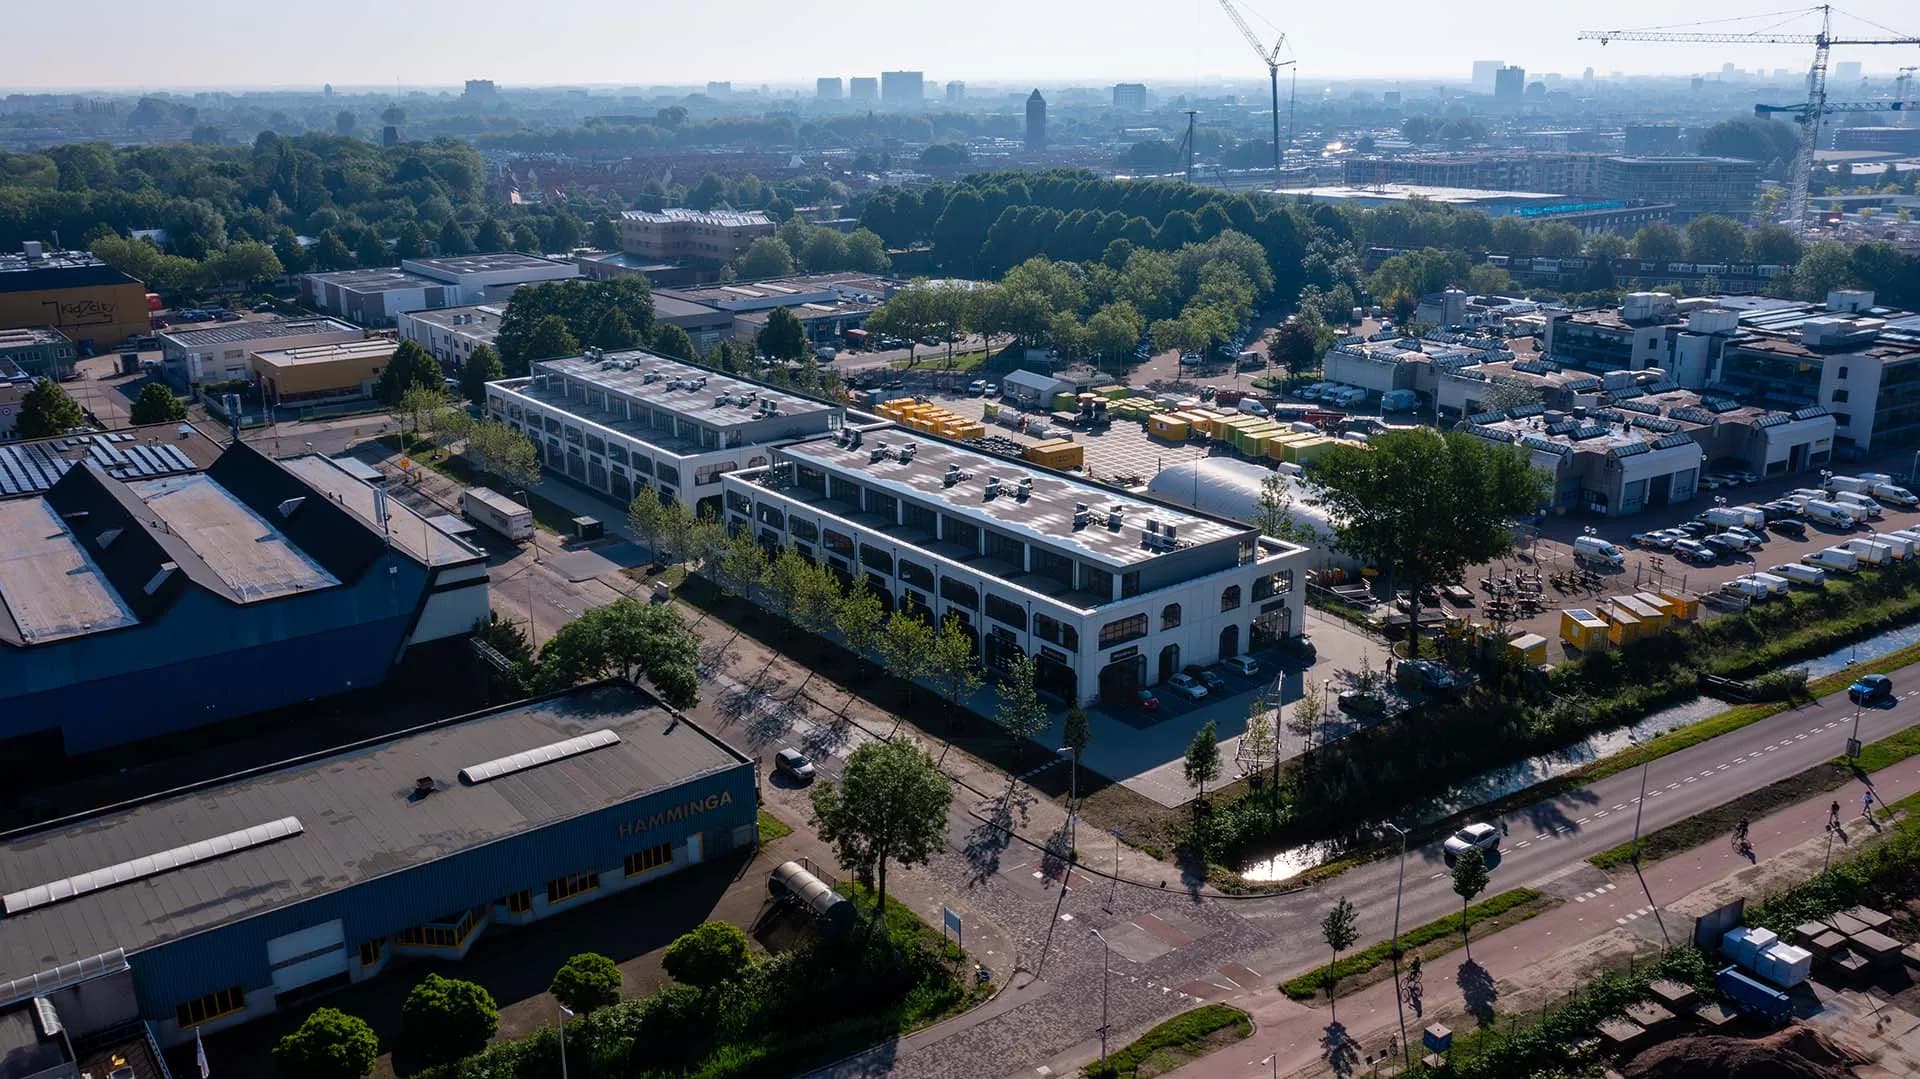
STOCK Utrecht
STOCK Utrecht
Schepenbuurt, Utrecht
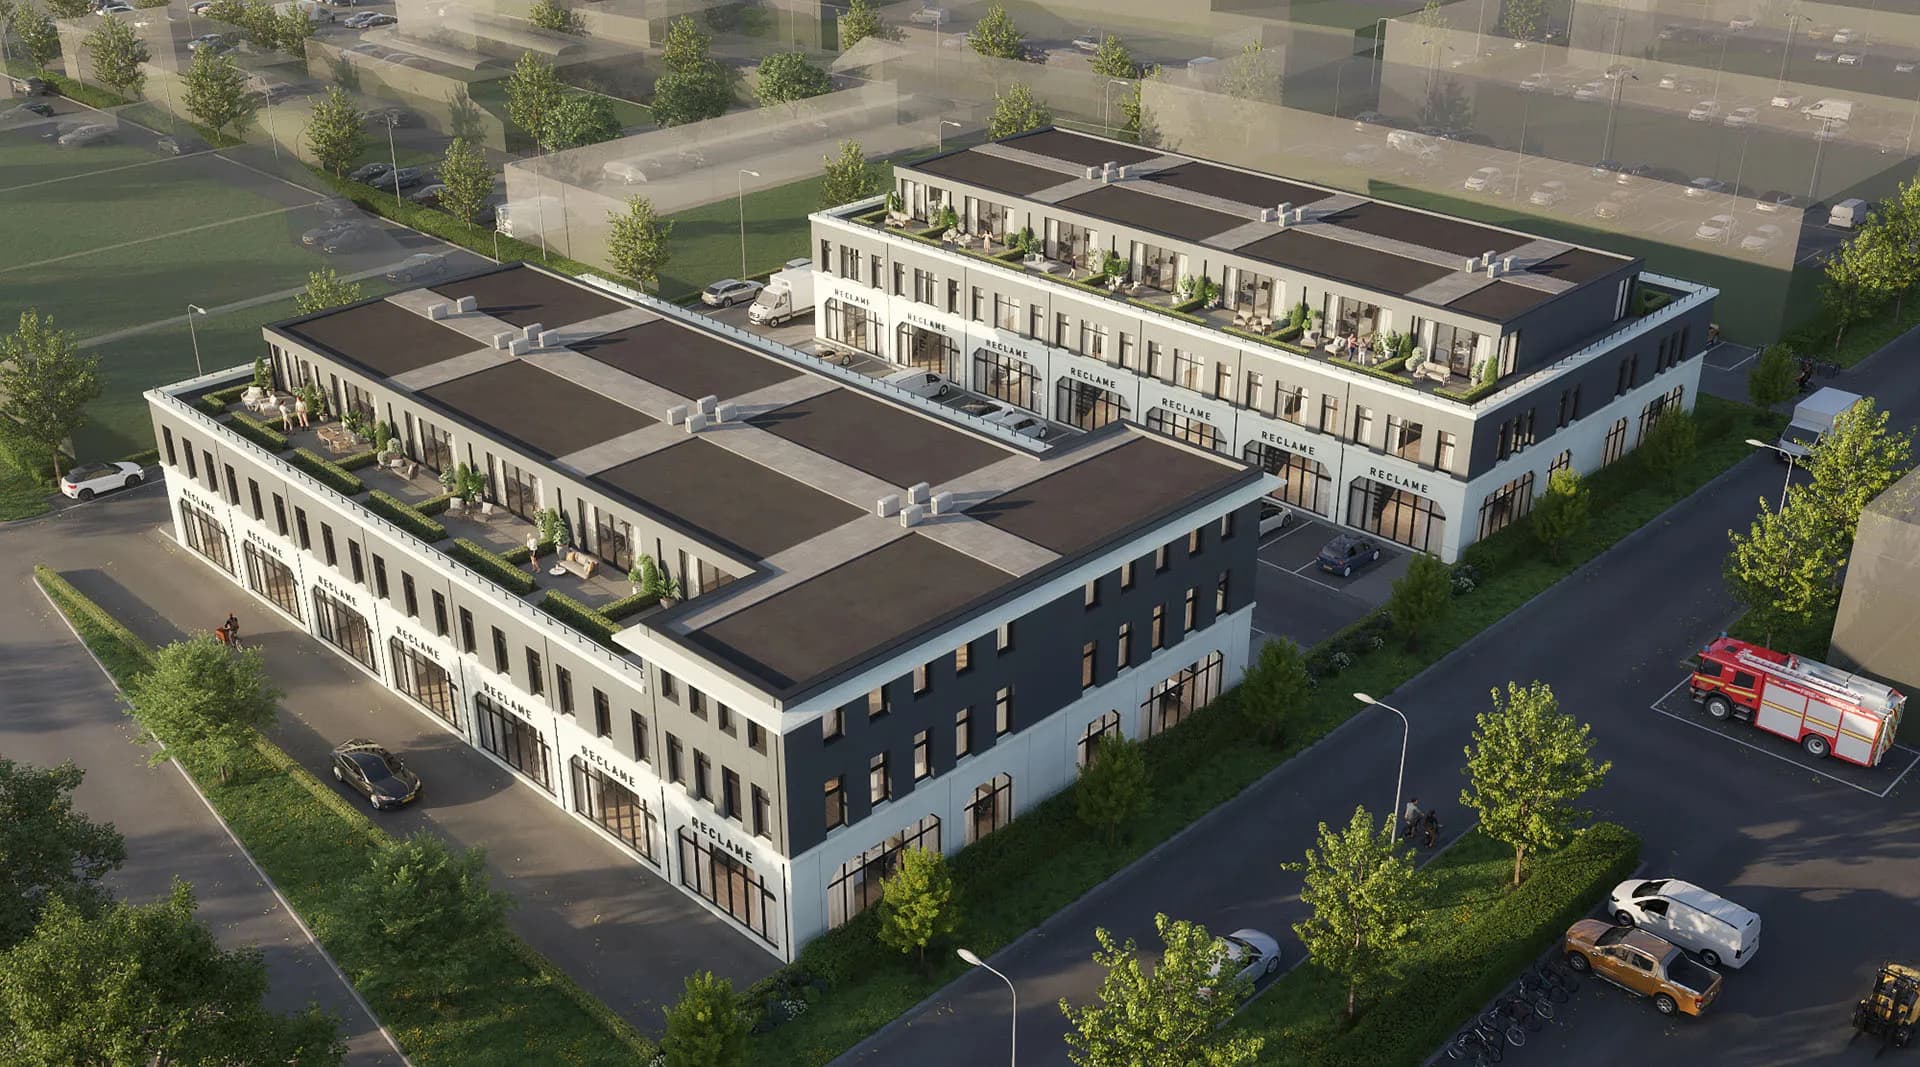
STOCK Utrecht Zuid
STOCK Utrecht Zuid
Rijnvliet, Utrecht
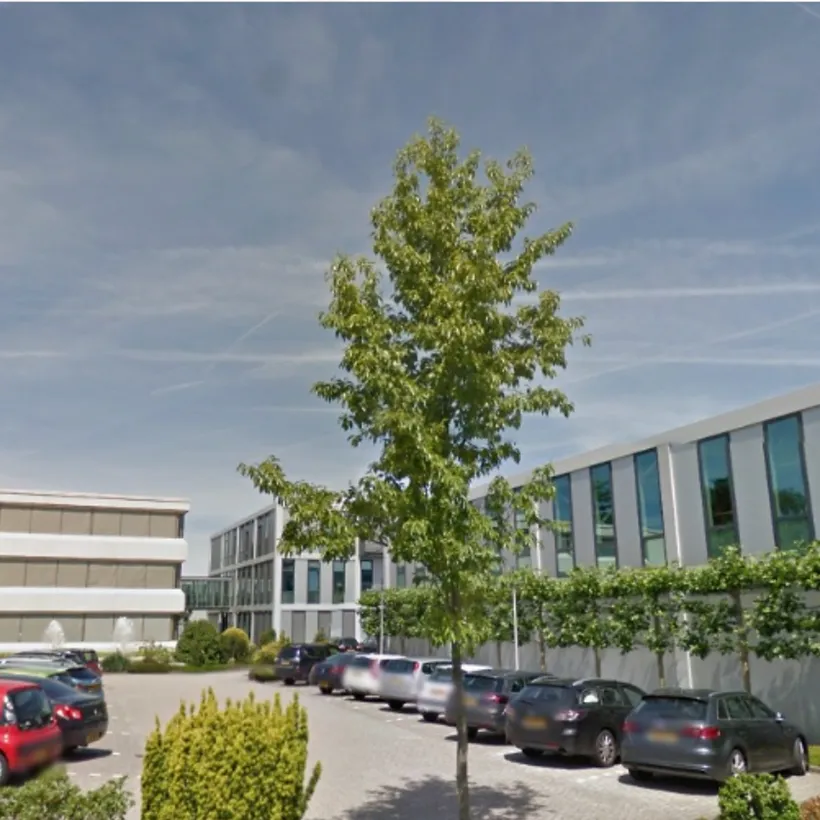
Overvecht, Utrecht
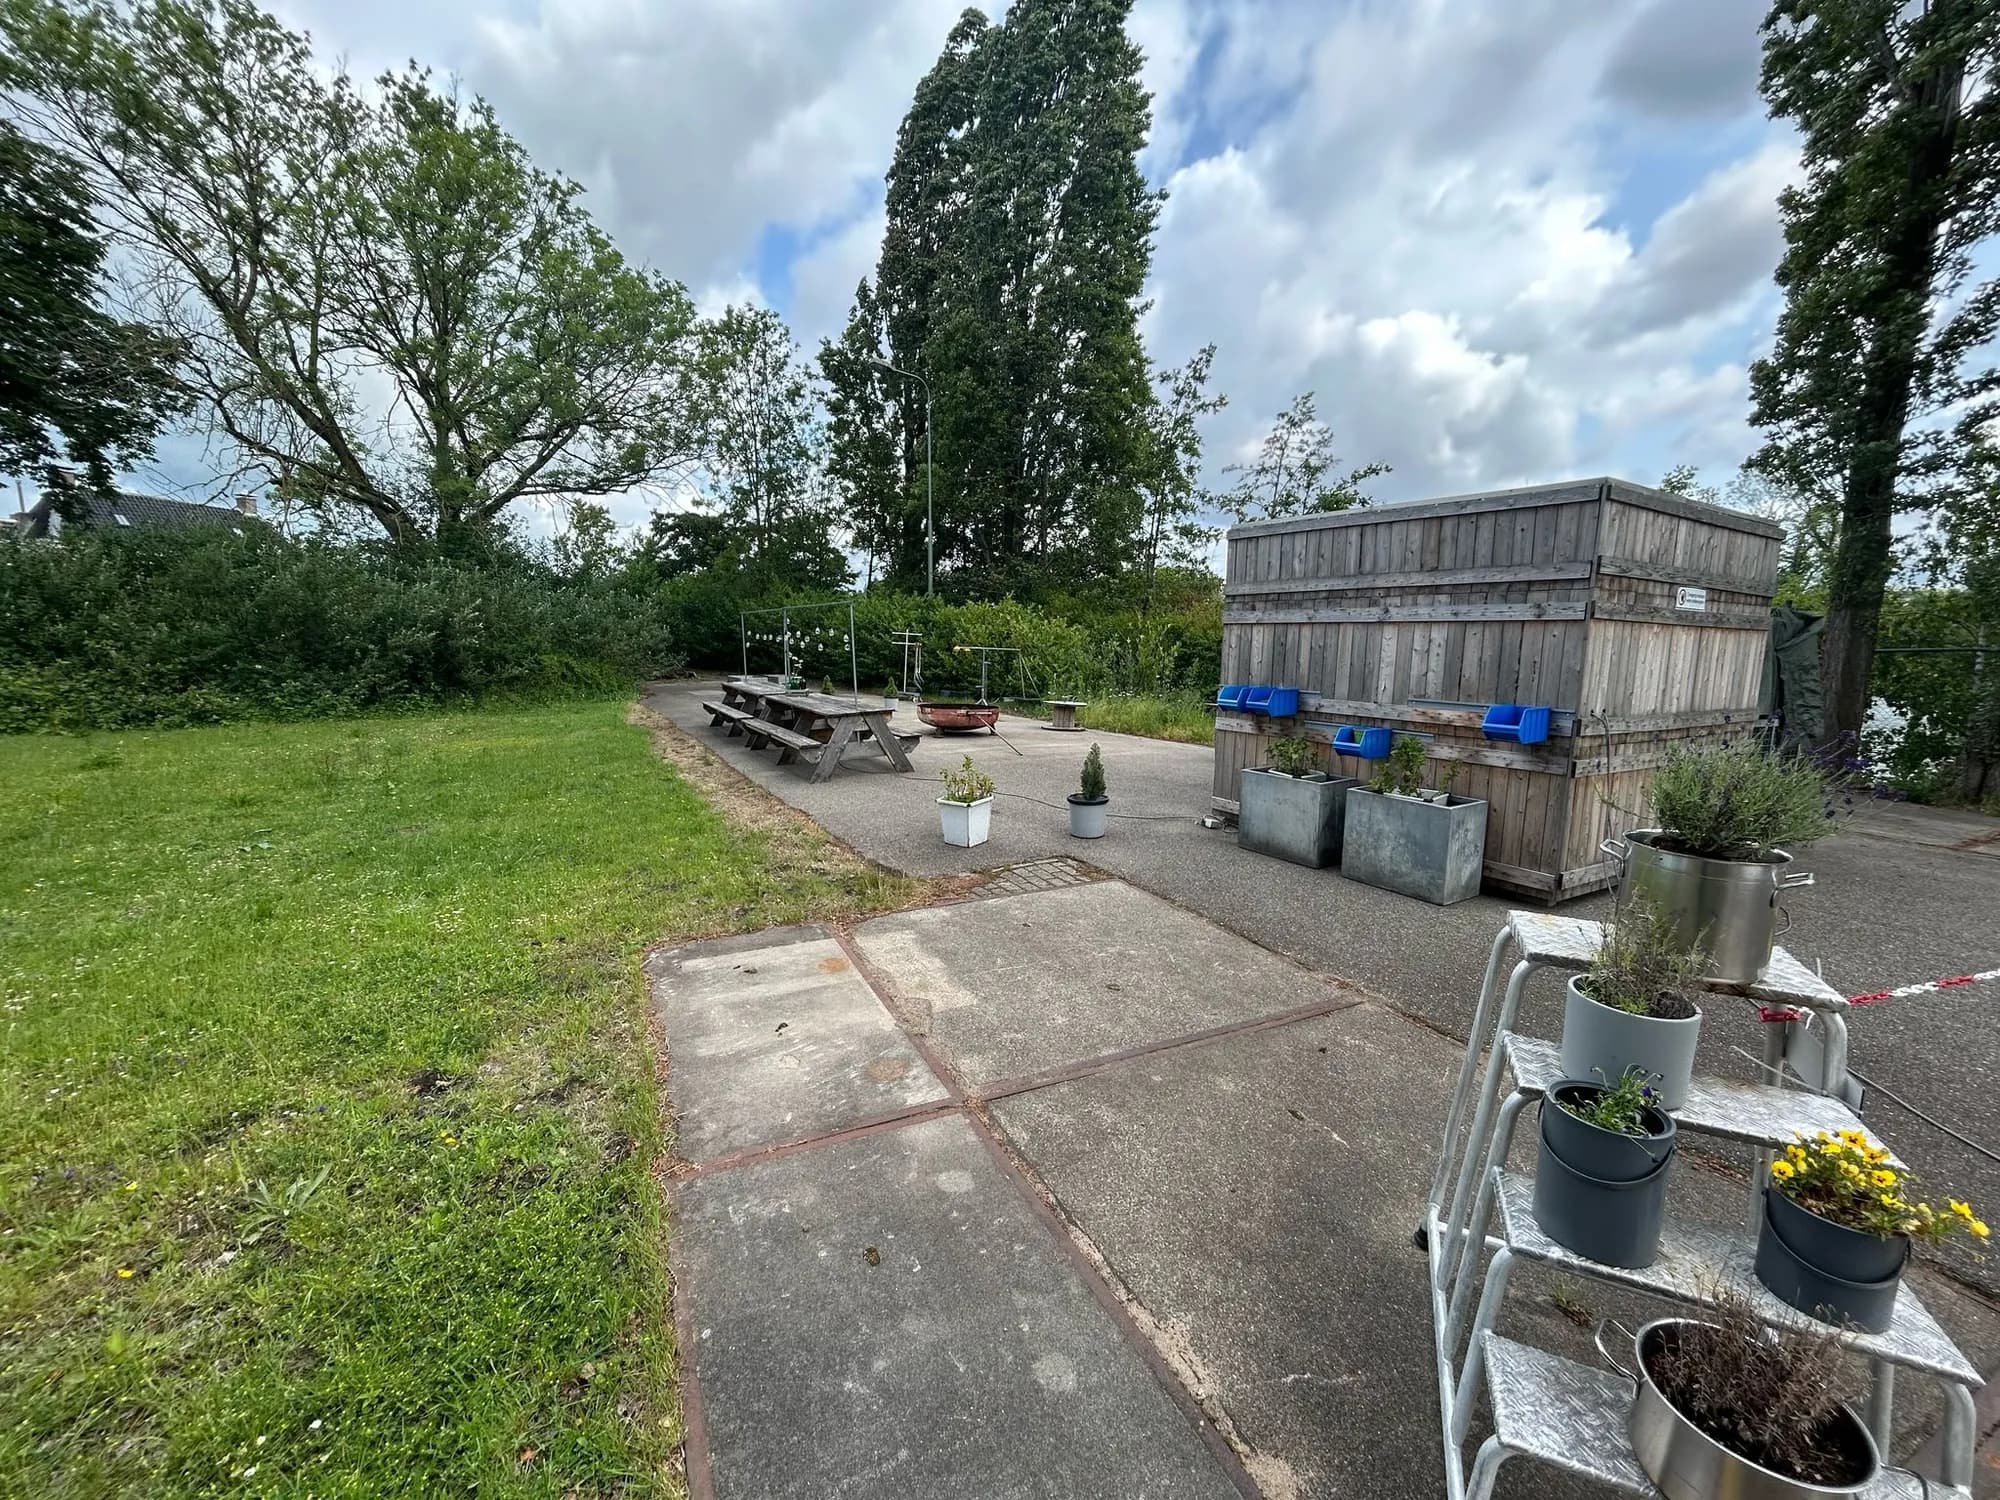
De Stadstuin Zeepfabriek
De Stadstuin Zeepfabriek
Rijnhuizen, Nieuwegein
Warehouse for rent
Warehouse for rent
Warehouse for rent
Warehouse for rent
Warehouse for rent
Warehouse for rent
Warehouse for rent
Warehouse for rent
Warehouse for rent
Warehouse for rent
Warehouse for rent
Warehouse for rent
Warehouse for rent
Warehouse for rent
Warehouse for rent
Warehouse for rent
Warehouse for rent
Warehouse for rent
Warehouse for rent
Data & insights
Calculated by RE-SEARCH from the current offering, building registries and CBS neighbourhood data.
Distribution across 3 labelled buildings.
67%
label A or better
Based on CBS address density around 3 locations.
The Utrecht offering sits mostly in dense urban surroundings (on average 1,718 addresses/km²). The surrounding neighbourhoods are dominated by business services and retail and hospitality (source: Statistics Netherlands).
Share of locations with this facility within 800 m.
Share of the offering with this amenity.
Known providers with locations in this area.
We know the Utrecht market
Leave a search request and get free, independent advice on the current offering.
Source: CBS Kerncijfers wijken & buurten
Number of establishments
Utrecht stands as a vibrant economic hub with 374,238 residents and a robust commercial landscape encompassing over 61,800 business establishments across 15,582 non-residential properties. The city's economy is notably driven by business services, which account for 18,835 company locations and reflect Utrecht's status as a major center for professional services, consulting, and corporate functions. Complementing this are significant public sector, education, and healthcare operations with 12,810 establishments, alongside a thriving culture, recreation, and service sector boasting 8,260 locations, and a considerable retail and hospitality presence with 7,940 venues. This sectoral diversity underscores Utrecht's character as a multifunctional city with strong demand across office, retail, and service-based commercial real estate.
For prospective tenants and buyers, Utrecht presents compelling fundamentals grounded in a highly engaged workforce of 222,030 employed professionals and a net labor participation rate of 75 percent, ensuring ready access to skilled personnel across sectors. The city's average household income of €38,500 per resident indicates solid purchasing power within the broader catchment area, supporting retail and hospitality ventures. The dominant presence of business services establishments positions Utrecht as exceptionally attractive for office and professional service operators seeking modern commercial space, while the scale of retail, hospitality, and cultural venues indicates sustained demand for premium ground-floor retail and mixed-use properties. For logistics and light industrial uses, the city's infrastructure and central location complement these sector strengths.
CBS dataset: 85984NED · Last updated: June 29, 2026

Miquel van Dongen
Tech Director
As Tech Director at RE-SEARCH, Miquel van Dongen is co-responsible for developing the platform and for collecting, structuring and analysing data. By combining technology with real estate expertise, he ensures that RE-SEARCH can continuously generate reliable and up-to-date market data.
At a glance
Industrial / warehouse space for rent in Utrecht: 3 properties. Largest supply in Overvecht, Schepenbuurt and Rijnvliet. 67% of listings carry energy label A or better. Available floor areas range from 218 to 1,000 m². As of 5 October 2026, source: RE-SEARCH supply analysis.
Market insights, tips and guides: immediately useful while you search.
 Marktinzicht
Amsterdam, Rotterdam, The Hague, Utrecht and Eindhoven each have a distinct real estate DNA. Here's how they compare across offices, logistics and retail.
MarktinzichtWhat does renting office space actually cost in 2026? Compare prices, hidden costs, and location value across Amsterdam, Rotterdam, Utrecht, and Eindhoven.
 Huurders
GFA, NLA and usable floor area explained under NEN 2580, with a worked example for an office building and tips for comparing rent per m² fairly.

